Northern Economic Index
Table of contents
- Methodology
- Indicators
- Total Number of People Employed in the Territories
- Average Unemployment Rate in the Territories
- Household Disposable Income in the North
- Average Weekly Earnings in the North
- Own-Source Tax Revenue as a part of Total Territorial Tax Revenues
- Mineral Exploration and Deposit Appraisal Expenditures in the North
- Trade Balance in the Territories
- Northern Economic Index Interpretation
The Northern Economic Index (NEI) is an important part of the Agency's Report on Plans and Priorities and serves not only as a measure of the state of economic development in Canada's territories, but also as a performance indicator for CanNor's Economic Development Program.
NEI is comprised of indicators which illustrate the state of the territorial economies: labour market, financial well-being of Northerners, fiscal health/self-sufficiency of territorial governments, investment in the territories and business activity.

Text description: the Northern Economic Index (NEI).
The NEI is comprised of the following components:
- Annual change in the number of people employed in the North (Labour Market indicator).
- Annual change in Unemployment rate in the North (Labour Market indicator).
- Annual change in Household Disposable Income in the North (Financial well-being indictor).
- Annual change in Average Weekly Earnings in the North (Financial well-being indicator).
- Annual change in Own Source Tax Revenue in the North (Fiscal health /self-sufficiency indicator).
- Annual change in Mineral Exploration Spending (Investment indicator).
- Annual change in Trade Balance in the North (Business Activity indicator).
The North constitutes the three territories.
Methodology
NEI measures the percentage of annual growth or decline for each of the seven indicators over a 6-year "rolling" period. The annual change in each indicator is then converted to a common 5-point scale, thereby allowing data on different scales to be compared.
Over a 6-year period, each indicator is assigned a score from 0 – 5, with 0 being assigned to the lowest change and 5 being assigned to the highest change. Thus, with all seven indicators counting, the NEI can range from 0 to 35.
Data was collected for each territory over the 2010 to 2015 period. In order to generate a 'northern indicator' that covers all three territories, the data was either subject to averaging (e.g., average unemployment rate) or summation of three territorial figures for any given year (e.g., number of people employed).
NEI is constructed in the context of a 6-year "rolling" period and is based on relativity, i.e. any given annual change in each indicator is relative to annual changes within the associated 6-year period. Therefore, the NEI score for a given year may change in future years as the relative performance in that year is compared to new data.
Major data sources for the Index included Statistics Canada territorial economic accounts, Territorial Bureaus of Statistics and Territorial Public Accounts.
Indicators
1. Total Number of People Employed in the North
A useful indicator of the state of the northern labour market is the total number of people employed in the territories. In 2015, this population decreased for the second year in a row, largely due to the slowdown in the mining sector as a result of low commodity prices.
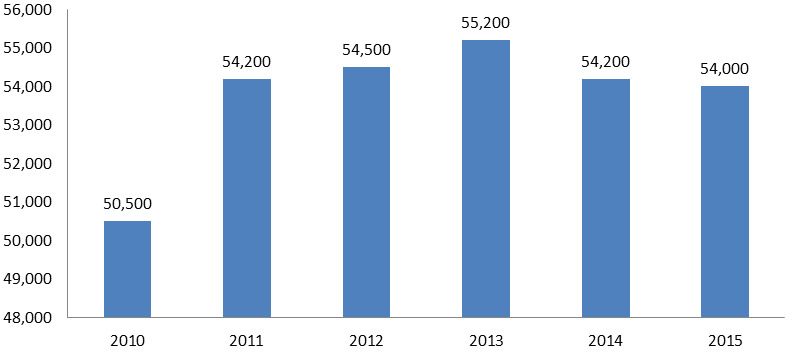
Text description: This graph shows the total number of people employed in the North from 2010 to 2015
- In 2010, 50,500 people were employed.
- In 2011, 54,200 people were employed.
- In 2012, 54,500 people were employed.
- In 2013, 55,200 people were employed.
- In 2014, 54,200 people were employed.
- In 2015, 54,000 people were employed.
Source: CANSIM Table 282-0123

Text description: This chart shows the annual change in the number of people employed in the North from 2010 to 2015.
- In 2010, the annual change was 2.9%.
- In 2011, the annual change was 7.3%.
- In 2012, the annual change was 0.6%.
- In 2013, the annual change was 1.3%.
- In 2014, the annual change was minus 1.8%.
- In 2015, the annual change was minus 0.4%.
2. Average Unemployment Rate in the Territories
The unemployment rate is defined as the number of unemployed persons divided by the labour force (the labour force is the number of unemployed persons plus the number of employed persons). In 2015, the unemployment rate rose to 9.5%, which was higher than the national rate of 6.9%. However, there continues to be significant differences amongst the territories. In 2015, the unemployment rate in Nunavut was 15.9%, in the Northwest Territories it was 8.3% and in the Yukon it was 6.3%. This pattern has remained consistent over the past six years.

Text description: This chart shows the average unemployment rate in the North from 2010 to 2015.
- In 2010, the average unemployment rate was 9.2%.
- In 2011, the average unemployment rate was 8.9%.
- In 2012, the average unemployment rate was 9.6%.
- In 2013, the average unemployment rate was 8.6%.
- In 2014, the average unemployment rate was 8.1%.
- In 2015, the average unemployment rate was 9.5%.
Source: CANSIM Table 282-0123

Text description: This chart shows the annual change in the unemployment rate in the North from 2010 to 2015.
- In 2010, the annual change in the unemployment rate was 1.1%.
- In 2011, the annual change in the unemployment rate was minus 0.3%.
- In 2012, the annual change in the unemployment rate was 0.7%.
- In 2013, the annual change in the unemployment rate was minus 1.0%.
- In 2014, the annual change in the unemployment rate was minus 0.5%.
- In 2015, the annual change in the unemployment rate was 1.4%.
3. Household Disposable Income in the North
Household disposable income is defined as income available to the household after all appropriate taxes have been paid. Household disposable income is a microeconomic measure of the financial well-being of Northerners and indicates how much money people have at their disposal to purchase goods and services.
The data was collected for each of the territories separately. The average was then obtained to be used as an indicator for the North. Household disposable income has grown substantially over the past five years; however, the rate of growth has slowed in three of the last four years.

Text description: This chart shows the average household disposable income in the North from 2010 to 2014.
(millions of dollars at current prices)
- In 2010, the average household disposable income was $1,252.
- In 2011, the average household disposable income was $1,295.
- In 2012, the average household disposable income was $1,334.
- In 2013, the average household disposable income was $1,396.
- In 2014, the average household disposable income was $1,426.
Sources: Statistics Canada, Provincial and Territorial Economic Accounts Review. Data from 2015 not yet available.

Text description: This chart shows the annual change in household disposable income in the North from 2010 to 2014.
- In 2010, the annual change in household disposable income was 7.0%.
- In 2011, the annual change in household disposable income was 3.5%.
- In 2012, the annual change in household disposable income was 3.0%.
- In 2013, the annual change in household disposable income was 4.6%.
- In 2014, the annual change in household disposable income was 2.1%.
4. Average Weekly Earnings in the North
Average weekly earnings are a measure of wage levels in the northern workforce. This measure of the quality of paid employment is considered one of the key economic indicators and represents a macroeconomic measure of the financial well-being of people who work in the North.
Average weekly earnings in the territories are some of the highest in Canada, with those in the Northwest Territories being the highest in the country due to the high wages associated with the diamond mining sector.
Although the rate of growth has been variable, the data indicates that average weekly earnings have been steadily growing in the North. This is in part due to the major projects development sector as well as the large public sector.
Average weekly earnings data was collected and is presented in nominal terms (i.e. it has not been adjusted for inflation).

Text description: This chart shows the average weekly earnings in the North from 2010 to 2015.
- In 2010, average weekly earnings were $1,063.
- In 2011, average weekly earnings were $1,110.
- In 2012, average weekly earnings were $1,149.
- In 2013, average weekly earnings were $1,177.
- In 2014, average weekly earnings were $1,226.
- In 2015, average weekly earnings were $1,243.
Source: CANSIM Table 281-0027
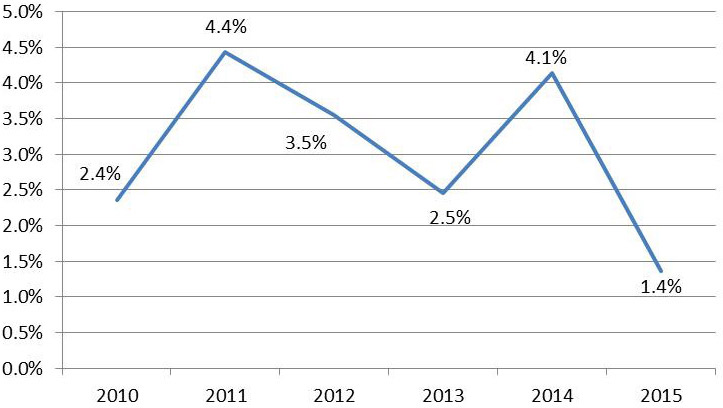
Text description: This chart shows the annual change in average weekly earnings in the North from 2010 to 2015.
- In 2010, the annual change was 2.4%.
- In 2011, the annual change was 4.4%.
- In 2012, the annual change was 3.5%.
- In 2013, the annual change was 2.5%.
- In 2014, the annual change was 4.1%.
- In 2015, the annual change was 1.4%.
5. Own-Source Tax Revenue as a part of Total Territorial Tax Revenues
Own-source tax revenues are an indicator of the fiscal health and self-sufficiency of territorial governments and its ability to provide services to its population.
Own-source tax revenues include personal income taxes, corporate and sales taxes, tobacco and gasoline taxes, payroll taxes, royalties, and other.
Own-source tax revenues are a fraction of total territorial tax revenues, as the territorial economies do not yet generate enough tax revenues to be self-sufficient. The Government of Canada fills the gap between territorial fiscal needs and fiscal capacity via Territorial Formula Financing (TFF), an annual unconditional transfer to territorial governments to help them fund essential public services in the North, such as hospitals, schools, infrastructure and social services.
Territorial own-sourced revenue peaked in 2010-2011. The fall in the subsequent four of the five years was due to both declining territorial revenues, as well as increasing federal transfers.

Text description: This chart shows the average own source tax revenue as a portion of the territorial tax revenues from 2010-11 to 2015-2016.
- In 2010-11, the average own source tax revenue was 23.7%.
- In 2011-12, the average own source tax revenue was 22.3%.
- In 2012-13, the average own source tax revenue was 20.6%.
- In 2013-14, the average own source tax revenue was 19.4%.
- In 2014-15, the average own source tax revenue was 19.6%.
- In 2015-16, the average own source tax revenue was 18.2%.
*2015-16 figure represents revised estimates.
Sources: Territorial Finance Public Accounts

Text description: This chart shows the annual change in average own source tax revenues in the North from 2010-11 to 2015-16.
- In 2010-11, the annual change in average own source tax revenue was 2.3%.
- In 2011-12, the annual change in average own source tax revenue was minus 1.4%.
- In 2012-13, the annual change in average own source tax revenue was minus 1.7%.
- In 2013-14, the annual change in average own source tax revenue was minus 1.2%.
- In 2014-15, the annual change in average own source tax revenue was 0.1%.
- In 2015-15, the annual change in average own source tax revenue was minus 1.4%.
6. Mineral Exploration and Deposit Appraisal Expenditures in the North
Mineral exploration and deposit appraisal expenditures in the North are a measure of investment and an indicator of business activity in the territories.
Mining exploration and deposit appraisal expenditures include on-mine-site and off-mine-site activities including field work, overhead costs, engineering, economic and pre- or production feasibility studies, environment, and land access costs.
The data was collected for each territory separately and the total number of mineral explorations in the three territories was used as an indicator for the North.
Mineral exploration peaked in 2011 and fell off in the subsequent three years largely as a result of declining commodity prices. Although prices remain low, spending in 2015 is projected to increase as a result of increased activity in Nunavut.

Text description: This chart shows the mineral exploration expenditures in the North (millions of dollars) from 2010 to 2015.
- In 2010, mineral exploration and deposit appraisal expenditures were $495.3 million.
- In 2011, mineral exploration and deposit appraisal expenditures were $961.2 million.
- In 2012, mineral exploration and deposit appraisal expenditures were $764.4 million.
- In 2013, mineral exploration and deposit appraisal expenditures were $436.1 million.
- In 2014, mineral exploration and deposit appraisal expenditures were $366.9 million.
- In 2015, projected mineral exploration and deposit appraisal expenditures is $389.7 million.
Source: Natural Resources Canada, from the federal-provincial-territorial Survey of Mineral Exploration, Deposit Appraisal and Mine Complex Development Expenditures.

Text description: This chart shows the annual change in mineral exploration and deposit appraisal expenditures in the North from 2010 to 2015.
- In 2010, the annual change in mineral exploration and deposit appraisal expenditures was 53.5%.
- In 2011, the annual change in mineral exploration and deposit appraisal expenditures was 94.1%.
- In 2012, the annual change in mineral exploration and deposit appraisal expenditures was minus 20.5%.
- In 2013, the annual change in mineral exploration and deposit appraisal expenditures was minus 42.9%.
- In 2014, the annual change in mineral exploration and deposit appraisal expenditures was minus 15.9%.
- In 2015, the annual change in mineral exploration and deposit appraisal expenditures is projected to be 6.2%
7. Trade Balance in the Territories
The balance of trade in the three territories was chosen as a measure of business activity in the North. The balance of trade (or net exports) is defined as the difference between the monetary value of exports and imports. The balance of trade includes both interprovincial and international transactions.
The data gathered for the three territories showed that imports outweigh exports creating a trade deficit.
The territorial economies are less mature than the provincial economies. Thus, it is common for imports to outweigh exports, i.e. the economies do not have a strong manufacturing base, exports constitute primary commodities, and most goods and services have to be imported to build up the business activity and to respond to the consumers' demands with growing incomes. Therefore, the assumption is made for the purpose of constructing the NEI that there is a positive relationship between the expansion of the territorial economy and the increase in imports (larger trade deficit).
The trade deficit across the North peaked in 2011. Although still lower than the peak, trade deficits have started to climb in 2013 and 2014.
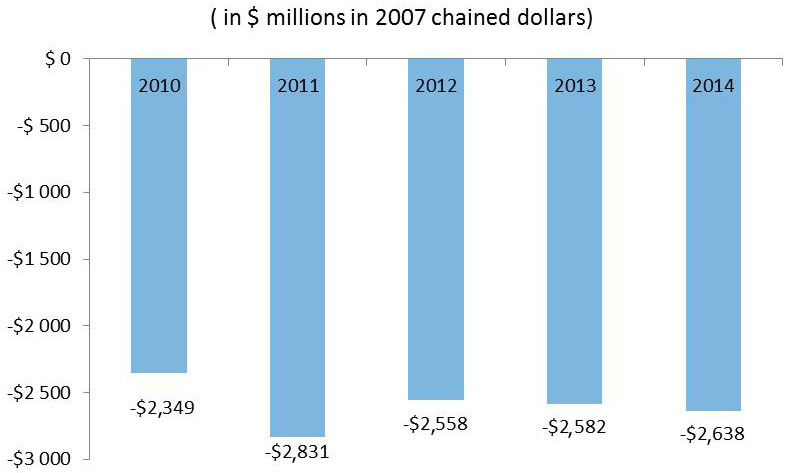
Text description: This chart shows the trade deficit in the North from 2010 to 2014.
(in $ millions in 2007 chained dollars)
- In 2010, the trade deficit in the North was minus $2,349.
- In 2011, the trade deficit in the North was minus $2,831.
- In 2012, the trade deficit in the North was minus $2,558.
- In 2013, the trade deficit in the North was minus $2,582.
- In 2014, the trade deficit in the North was minus $2,638.
Source: Statistics Canada, Economic Accounts. The data for 2015 is not yet available.

Text description: This chart shows the annual change in trade deficit in the North from 2010 to 2014.
- In 2010, the annual change was 9.8%
- In 2011, the annual change was 20.5%.
- In 2012, the annual change was minus 9.6%.
- In 2013, the annual change was 0.9%.
- In 2014, the annual change was 2.2%.
Northern Economic Index Interpretation
In 2010 and 2011, the northern economy rebounded from the global recession and showed a positive annual change in every indicator. The NEI Index shows that these years experienced the strongest levels of the growth in this six year period. In 2012, lower commodity prices once again impacted mineral exploration spending and slowed positive growth.
In 2013 and 2014, NEI showed moderate economic expansion in the North. The territories saw a decrease in the unemployment rate and an increase in average weekly earnings. Weaker commodity prices (base and precious metal prices, in particular) and tight capital markets for junior exploration companies held back mineral exploration across the North, similar to other regions of Canada.
The NEI value of 4.5 reaffirms that in 2015 there was a contraction in economic activity in the North relative to the previous years (2010 to 2015). The territories saw an increase in their unemployment rate, a decrease in own-source revenues generated by territorial governments, and a decrease in the rate of growth in average weekly earnings. Despite a slight increase in mineral exploration spending, the North observed a decline in resource development sector activity. Given the dependence on this sector, this decline contributed to reduce economic activities in other areas.
As of October 1, 2016, the scheduled releases of two of NEI's seven indicators (territorial trade balance and household disposal income) had not yet occurred. As such, previous year's figures were used for the purpose of the Northern Economic Index for 2015.
 on a 35-point scale
Text description: This chart shows the Northern Economic Index (NEI) interpretation – on a 35-point scale – from 2010 to 2015.
- In 2010, the NEI was 21.5.
- In 2011, the NEI was 25.5.
- In 2012, the NEI was 8.5.
- In 2013, the NEI was 13.5.
- In 2014, the NEI was 13.5.
- In 2015, the NEI was 4.5.