Towards a Pan-Territorial Growth Strategy
PDF Version (562 Kb, 17 pages)
Working together for a better future
The world is changing. In an era of intense global competition, Canadians must build on past achievements, address challenges head on, and work to seize new economic opportunities that position us for the future.
To help the territories compete in this new reality, the Canadian Northern Economic Development Agency (CanNor) is working with territorial and Indigenous governments, industry, Indigenous communities and organizations, and academia to develop a Pan-Territorial Growth Strategy. The purpose of this Strategy is to help stimulate economic growth, which reflects the unique advantages of each territory.
To inform the development of this strategy CanNor will be holding in-person roundtables and teleconferences in the 3 territories with a broad range of partners and stakeholders in early 2019.
CanNor: what we do:
CanNor has three key, interrelated business lines and services that the Agency can use to advance a Pan-Territorial Growth Strategy in partnership with territorial and Indigenous governments, stakeholders, and other federal departments:
- Delivering contribution programs such as the Strategic Investments in Northern Economic Development, the Northern Aboriginal Economic Opportunities Program, among other programs (e.g., Northern Adult Basic Education Program).
- Operating the Northern Projects Management Office which provides issues management, path-finding, and advice to industry and communities; and leads the federal coordination of crown consultations in the regulatory review process.
- Serving as a voice for the territories within federal policy processes.
What is the Pan-Territorial Growth Strategy?
In April 2017, The Minister of Innovation, Science, and Economic Development, announced that each region of the country will develop its own regional growth strategy to advance inclusive economic growth based on the unique strengths and opportunities of each region. As of June 2018, the Atlantic Canada Opportunities Agency and the Federal Economic Development Agency for Northern Ontario have developed regional growth strategies
CanNor is developing a Pan-Territorial Growth Strategy. It will focus on targeted initiatives across a few areas of action where we can work in collaboration with territorial and Indigenous partners and stakeholders over a five year period.
The Growth Strategy will help advance the economic elements of Arctic and Northern Policy Framework (ANPF) in the three territories. The ANPF is a broad, long term, high level framework currently under co-development. It will replace Canada's Northern Strategy (2009) and the Statement on Canada's Arctic Foreign Policy (2010).
The table below highlights how the ANPF and the Pan-Territorial Growth Strategy work together.
Who is being engaged?

Description of Arctic and Northern Policy Framework and Pan-Territorial Growth Strategy Synergies
| Arctic and Northern Policy Framework | Pan-Territorial Growth Strategy | |
|---|---|---|
| Policy Scope | Multiple goals, Whole-of-government | Targeted economic initiatives stemming from the economic goal for the ANPF |
| Duration | Until 2030 | 5 year strategy with an initial focus on targeted initiatives in the first two years |
| Geographic Scope | Territories, Inuit Nunangat, and northern Manitoba | Yukon, Northwest Territories, Nunavutt |
It is essential that the views of those most directly involved and affected help shape the foundation of the Pan-Territorial Growth Strategy.
Because there is strength in diversity, this engagement paper invites input from:
- Territorial and municipal governments;
- industry;
- businesses;
- women, youth, and recent immigrants;
- economic development organizations;
- colleges and research institutes; and
- individual Canadians.
Given the critical role played by Indigenous people and governments in the Northern Economy, CanNor will also have focused engagement with Inuit, First Nations, and Métis governments and organizations.
At its core, the strategy is about growing the economy, attracting investment, and creating middle class jobs for Northerners and all Canadians. To do this, we need to think boldly and work together to focus our efforts on advancing territorial strengths.
What we have heard so far?
In Summer 2017, CanNor held a series of roundtables in the territories to inform renewal of its economic development programming. Roundtables and public engagements sessions were also held in the Fall 2017/Winter 2018 as part of the process to develop the ANPF.
Our territorial and Indigenous partners, as well as other northern stakeholders, highlighted a number of challenges in the territories that hamper the pace of development, including a significant infrastructure deficit and a higher cost of doing business related to remote locations, harsh environment, and sparse population distribution.
Partners and stakeholders also highlighted many opportunities such as leveraging the knowledge economy, tourism and expanding off-shore and in-shore fisheries.
They also expressed the need for continued foundational investments in capacity–building and skill development, and in infrastructure. While it was noted that the territorial economies will continue to need both sustainable resource extraction and the development of other sectors including traditional economic activities, differing perspectives were offered over what is the "right" mix.
Many participants emphasized that research, innovation, and commercialization, particularly through entrepreneurship, would help strengthen and diversify territorial economies. Specific measures mentioned included increasing access to capital as well as other business supports, such as collaboration spaces and incubators for business skills development.
Proposed areas of action for the Pan-Territorial Action Plan
Based on collected feedback, CanNor is proposing the following action areas to focus the Agency's activities, in collaboration with its partners and stakeholders, over the next five years. Actions will integrate the existing work of territorial governments (e.g. Northwest Territories' Economic Opportunities Strategy). Initiatives to promote innovation will be included in all areas of action.
Resource extraction sectors
Support the sustainable development of the resource extraction sectors in a manner which increases community capacity and maximizes jobs and wealth within the territories.
Economic diversification and innovation
Foster the sustainable growth of other economic sectors, such as tourism, with an initial focus on strengthened entrepreneurship and northern innovation.
Infrastructure investments and development
Leverage upcoming investments and the ongoing operation of major infrastructure projects to maximize local and regional economic opportunities.
Skilled workforce
Help build a northern workforce and equip Northerners with the tools, skills, and experience they need to succeed in the workforce, now and into the future.
Questions
We are seeking your ideas to build a strong, growing economy in the territories. Whether you live in an urban area or a small community; are a business leader or just starting a business; are an individual or part of an organization, CanNor would like to know what matters most to you. Your comments will help develop this growth strategy to guide Northern economic development policy and investment decisions.
Are the four proposed action areas the right ones? If not, what would be your top four?
For the economic diversification action area, what three sectors should be prioritized? How should Tourism be supported?
For each action area, what specific activities should CanNor advance in collaboration with its partners?
How can Indigenous economic development corporations and the private sector be engaged to increase the effectiveness of the four proposed action areas?
The current regional landscape
On the pages that follow, you will find ten one-page primers on the following key aspects of the territorial economies that can help inform your views:
This engagement paper seeks your ideas and recommendations to create a powerful growth strategy for the territories. At the end of this paper are instructions on how to share your input with CanNor if you wish to contribute comments and ideas.
Demographics
Canada's three territories are home to…
| Geography | Population (2016) |
|---|---|
| Yukon | 35,874 |
| Northwest Territories | 41,786 |
| Nunavut | 35,944 |
- 0.32% of Canada's population (113,604).
- 3.56% of Canada's Indigenous population (First Nations, Métis, and Inuit).
- A fast growing population in Yukon and Nunavut.
Did you know…
Approximately 2,095 people immigrated to the territories between 2011 and 2016, representing almost 2% of the region's population.
Community Growth Rates
(2011-2016)
- Whitehorse, YT: 7.8%
- Fort Smith, NWT: 25.3%
- Hay River, NWT: -2.6%
- Inuvik, NWT: -6.5%
- Yellowknife, NWT: 1.1%
- Arviat, NU: 38.9%
- Baker Lake, NU: 10.0%
- Cambridge Bay, NU: 11.5%
- Gjoa Haven, NU: -1.4%
- Iqaluit, NU: 10.3%
- Kugluktuk, NU: 1.0%
- Rankin Inlet, NU: 28.1%
Challenges and Opportunities
- All territories have a younger population than Canada as a whole; over 60% of the population is under the age of 40.
- The average age of the Indigenous population ranges between 2 and 5 years younger than for the non-Indigenous population.
- The territorial population is spread across more than 3.4 million square kilometers, which includes many remote communities.
Want to know more?

Source: Statistics Canada, Census 2016
Description of Percentage of Population by Age (2016)
Percentage of the population by age (2016)
The bar graph presents the proportion of the population by age range age for each territory compared to Canada. The proportion of territorial Canadians aged 0-14 years is approximately two percentage points higher than the same age ranges for Canada. Additionally, the proportion of the Canadians in the 50+ years age ranges is higher compared to the territories.
| Age | Yukon (%) | Northwest Territories (%) | Nunavut (%) | Canada (%) |
|---|---|---|---|---|
| 0-4 | 6.0 | 7.5 | 11.6 | 5.4 |
| 5-9 | 5.9 | 7.2 | 11.5 | 5.7 |
| 10-14 | 5.6 | 6.6 | 9.5 | 5.5 |
| 15-19 | 5.4 | 6.5 | 8.7 | 5.8 |
| 20-24 | 5.5 | 7.3 | 8.5 | 6.4 |
| 25-29 | 7.1 | 8.3 | 8.9 | 6.5 |
| 30-34 | 8.1 | 8.1 | 7.8 | 6.6 |
| 35-39 | 7.2 | 7.7 | 6.6 | 6.5 |
| 40-44 | 7.1 | 6.8 | 5.6 | 6.7 |
| 45-49 | 6.9 | 6.9 | 5.7 | 6.7 |
| 50-54 | 8.0 | 7.7 | 5.1 | 7.6 |
| 55-59 | 8.3 | 6.8 | 3.9 | 7.5 |
| 60-64 | 7.1 | 5.0 | 2.7 | 6.5 |
| 65-69 | 5.1 | 3.4 | 1.8 | 5.6 |
| 70-74 | 3.0 | 2.0 | 1.0 | 4.0 |
| 75-79 | 1.8 | 1.1 | 0.6 | 2.9 |
| 80-84 | 1.0 | 0.7 | 0.3 | 2.1 |
| 85+ | 0.8 | 0.5 | 0.2 | 2.2 |
Inuit, First Nations, and Métis Peoples
Canada's three territories are home to…
- More than half of Canada's Inuit population (53%).
- A high proportion of Indigenous peoples, 53.3% of the population in the territories identified as Indigenous in 2016, versus 4.9% in Canada at large.
Did you know…
The 2011 National Household Survey identified that 2% of the Indigenous population aged 15 and over in the territories were self-employed.
Landscape
- The Nunavut population is comprised of 86% Indigenous persons, compared to 51% in Northwest Territories and 23% in Yukon.
- The territorial Indigenous population includes more than 20,000 First Nation, 4,500 Métis, and 34,400 Inuit.
- 88% of the Inuit population in Canada's territories is located in Nunavut.
Challenges and Opportunities
- The territories have some of the highest unemployment rates for Indigenous persons in Canada.
- The traditional knowledge and practices of Indigenous Peoples are globally recognized as vital to sustainable development and climate change adaptation in the North.
Want to know more?
- National Aboriginal Economic Development Board: Reconciliation: Growing Canada's Economy by $27.7 Billion (PDF)
- National Aboriginal Economic Development Board: Investing in Canada's Future Prosperity: An Economic Opportunity for Canadian Industries (PDF)
- TD Economics: The Long and Winding Road Towards Aboriginal Economic Prosperity (PDF)
- Canadian Council for Aboriginal Business: Promise and Prosperity: the 2016 Aboriginal Business Survey (PDF)
Sources: Statistics Canada; Canadian Council for Aboriginal Businesses
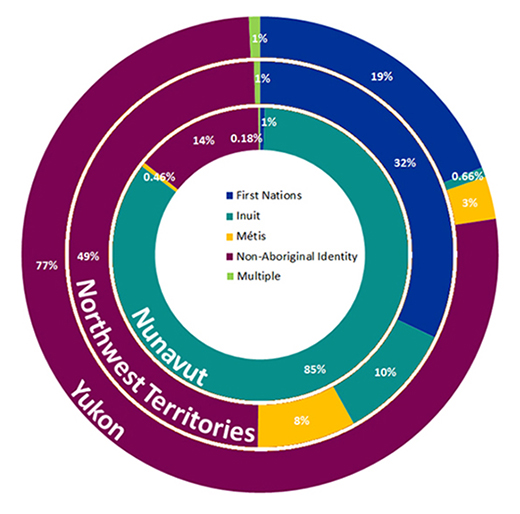
Description of Share of Population by Aboriginal Identity (2016)
The dough nut chart shows the identities of the Indigenous and non-Indigenous population in the territories in 2016 as a percentage.
| Geography | First Nation (%) | Metis (%) | Inuk (Inuit) (%) | Multiple & Other identities (%) | Non-Aboriginal Identity |
|---|---|---|---|---|---|
| Yukon | 19 | 3 | 0.66 | 1 | 77 |
| Northwest Territories | 32 | 8 | 10 | 1 | 49 |
| Nunavut | 1 | 0.46 | 85 | 0.18 | 14 |

Description of School-aged population (ages 5-24) with Aboriginal identity (2011)
In 2011, all three territories had a significantly higher proportion of school-aged children reporting an Indigenous identity than the national level.
| Geography | Percentage of School-Aged Population Reporting an Aboriginal Identity |
|---|---|
| Canada | 6% |
| Yukon | 32% |
| Northwest Territories | 65% |
| Nunavut | 95% |
Gross Domestic Product
Canada's three territories are have…
- A projected Gross Domestic Product (GDP) growth rate of 2.4% between 2018 and 2025, higher than the national projected growth rate of 1.8%.
Did you know…
- The Northwest Territories has had the highest GDP per capita in Canada for the past 5 years.
GDP Growth
(As projected by the Conference Board of Canada)
- Nunavut's real GDP is projected to grow 4.4% in 2018 and 9.1% in 2019.
- Northwest Territories' real GDP is expected to fall 2.9% in 2018 and by an average of 1.1% a year for the next 25 years.
- Yukon's real GDP growth will reach 8.1% in 2018 and will average 6.2% over 2019–25 before slowing down for the next 15 years.
Challenges and Opportunities
- All three territorial economies are heavily reliant on the extractive industries, which are subject to booms and busts.
- Nunavut is on the cusp of a mining boom due to increasing mining production and a number of new mines which are in development.
- The Northwest Territories' economy will soon experience a decrease in GDP with the closure of its largest diamond mine.
- Yukon has three new mines on the horizon, which will contribute to steady GDP growth over the next years.
Want to know more?
- Conference Board of Canada: Territorial Outlook Economic Forecast Spring 2018
- Government of Northwest Territories, Bureau of Statistics: Gross Domestic Product 2017 (PDF)
- Government of Nunavut, Department of Finance: 2017-18 Fiscal and Economic Indicators

Sources: Statistics Canada; Conference Board of Canada; Government of Nunavut Fiscal and Economic Indicators
Description of Canadian Territories Annual Change in GDP (2011-2017)
The percentage change between the current and previous year, in terms of Gross Domestic Product (GDP), is relatively stable at the national level from 2011 to 2017, but this is not the case for the territories which have seen major fluctuations in those same years.
| Geography | 2011 | 2012 | 2013 | 2014 | 2015 | 2016 | 2017 |
|---|---|---|---|---|---|---|---|
| Canada | 3.7% | 1.3% | 2.3% | 4.2% | 1.1% | 1.2% | 3.5% |
| Yukon | 4.9% | 4.0% | 1.5% | 0.6% | -7.9% | 8.3% | -1.4% |
| Northwest Territories | -9.2% | -0.6% | 2.8% | 4.7% | 1.2% | 0.8% | 5.2% |
| Nunavut | 5.8% | 2.5% | 10.1% | -1.3% | -0.6% | 1.9% | 13.3% |

Source: Statistics Canada
Description of Sectoral GDP Contributions in the Territories (2017)
In 2017, the public sector contributed the most to Gross Domestic Product (GDP) across all three territories, but only 18% of the GDP in Canada as a whole.
| Sector | Canada | Yukon | Northwest Territories | Nunavut |
|---|---|---|---|---|
| Public Sector (includes education and health) | 18% | 35% | 26% | 31% |
| Extractive industries (includes mining, quarrying, oil and gas) | 8% | 12% | 31% | 18% |
| Construction | 7% | 10% | 8% | 9% |
| Real Estate, Rental and Leasing | 13% | 14% | 8% | 10% |
| Transportation and Warehousing | 4% | 3% | 9% | 2% |
| Other (i.e., manufacturing; arts, entertainment and recreation; etc.) | 50% | 25% | 18% | 29% |
Labour Market
Canada's three territories are home to…
- Over 62,000 workers, approximately 0.32% of Canada's workforce.
- A regional participation rate (72.9%) that is higher than the national participation rate (65.2%).
- Just over 3% of Canada's Indigenous employment (20,295).
Did you know…
The 2011 National Household Survey identified that 2% of the Indigenous population aged 15 and over in the territories were self-employed.
Challenges and Opportunities
- Compared to the non-Indigenous unemployment rate, in 2016 the Indigenous unemployment rate was 16.4% higher in Yukon, 14.5% higher in Northwest Territories, and 24.6% higher in Nunavut.
- Since 2016, unemployment rates in all three territories have continued to decline - In 2017, the unemployment rate in the Yukon was 3.6%, 6.6% in Northwest Territories, and 14.6% in Nunavut.
- Unemployment rates outside the territorial capitals are consistently higher than the average territorial rates.
Want to know more?
- Government of Northwest Territories, Bureau of Statistics: Labour Force Activity, August 2018 (PDF)
- Government of Nunavut, Fiscal and Economic Indicators Budget 2017-2018 (PDF)

Description of Top Industries by Employment in the Territories (2016) (Estimate and share of regional total)
These graphs show quick snapshots of key labour market characteristics across the three territories as of 2016.
| Territories | % |
|---|---|
| Public Administration | 31% |
| Retail Trade | 12% |
| Health and Social Services | 11% |
| Education | 10% |
| Construction | 9% |
| Accommodation and Food Services | 7% |
| Transportation and Warehousing | 6% |
| Extractive Industries | 5% |
| Professional, scientific and technical | 5% |
| Other | 4% |

Sources: Statistics Canada; Government of Nunavut Fiscal and Economic Indicators
Description of Labour Market Snapshot (2016)
These graphs show quick snapshots of key labour market characteristics across the three territories as of 2016.
| Geography | Labour Market Indicator | Number |
|---|---|---|
| Yukon | Total Employment | 21,200 people |
| Yukon Participation Rate | 75.5% | |
| Yukon Unemployment Rate | 9.2% | |
| Whitehorse Unemployment Rate | 7.0% | |
| Outside Whitehorse Unemployment Rate | 21.1% | |
| Nunavut | Total Employment | 13,400 people |
| Nunavut Participation Rate | 68.3% | |
| Nunavut Unemployment Rate | 21.5% | |
| Iqaluit Unemployment Rate | 9.6% | |
| Outside Iqaluit Unemployment Rate | 27.6% | |
| Northwest Territories | Total Employment | 21,300 people |
| Northwest Territories Participation Rate | 74.1% | |
| Northwest Territories Unemployment Rate | 10.6% | |
| Yellowknife Unemployment Rate | 5.9% | |
| Outside Yellowknife Unemployment Rate | 21.9% |
Trade
International trade
- In 2017, the three territories exported over $2.4 billion in goods internationally, and imported over $158 million in merchandise (excluding services).
- Top destinations for merchandise exports were Europe (60%), Asia (24%), and Africa the Middle East (11%).
Did you know…
- Inter-provincial trade often plays an even larger role than international trade in territorial GDPs.
- Diamonds account for the vast majority of value in territorial international exports.
Challenges and Opportunities
- Lack of sufficient infrastructure puts the territories at a disadvantage in bringing goods to international markets compared to other Arctic nations.
- Yukon maintains the strongest trade relationship with the US due to the territory's proximity to the Alaskan border and the port in Skagway, Alaska.
- All three territories have increased engagement with Asia in recent years and these relationships are likely to continue to develop.
- Recently signed trade agreements have the potential to enhance Northern trading opportunities in the coming years.

Description of The Territories' Merchandise Exports by destination (2017)
The pie chart presents merchandise exports by destination for the territories. 60% of merchandise exports for the territories have a destination of Europe, followed by Asia at 24%.
| Geography | Percentage of Exports to Destination |
|---|---|
| Europe | 60% |
| Asia | 24% |
| Africa & Middle East | 11% |
| United States | 5% |
| Latin America | 0.21% |
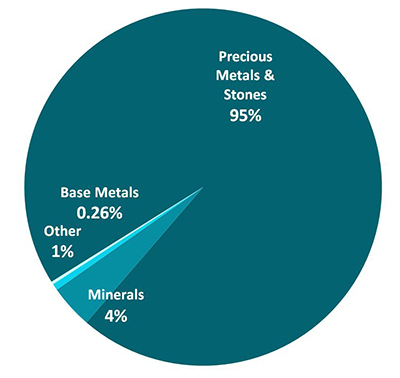
Description of The Territories' Merchandise Exports by product and value (2017)
The pie chart presents merchandise exports by product and value for the territories. Precious metals and stones make up 95% of merchandise exports for the territories.
| Industry | Percentage |
|---|---|
| Precious Metals and Stones | 95% |
| Minerals | 4% |
| Base Metals | 0.26% |
| Others | 1% |
*Includes NAICS codes 11, 21, 31, 32 and 33

Sources: Conference Board of Canada; Statistics Canada; Government of Canada, Trade Data Online
Description of The Territories' International Balance of Trade: Merchandise
Across the territories, the balance of trade for merchandise varies significantly.
| Year | Yukon | Northwest Territories | Nunavut |
|---|---|---|---|
| 2013 | 34,737 | 1,587,745 | -36,854 |
| 2015 | 34,899 | 1,842,509 | -49,629 |
| 2017 | 31,643 | 2,026,905 | 247,917 |
Natural Resources
Canada's three territories are home to…
- One quarter of Canada's discovered oil and gas resources and close to one third of Canada's overall potential.
- Large mineral deposits including diamonds, gold, base metals and silver, tungsten, uranium, rare earth elements, iron ore, zinc, and copper.
Did you know…
- Natural resource exploration and development potential in Nunavut, Yukon and the Northwest Territories is drawing global interest and investment.
- Over one-quarter of total economic activity in the Northwest Territories in 2016 was attributable to the natural resources sector.
- The United States Geological Survey estimated in 2009 that 13% of the world's undiscovered oil and 30% of its undiscovered gas could be found in the Arctic Circle.
Challenges and Opportunities
- The Conference Board of Canada has projected that as of 2020, mining in Canada's territories is anticipated to nearly double from 2011 reference levels, with a predicted compound annual growth rate of 7.5% in the territories compared to 2.2% in the rest of Canada.
- Many emerging technologies rely on natural resource development as they are constructed with rare-earth elements.
- Mines have limited lifespans, and each mine closure can have a significant impact on a territory's GDP. However, remediation efforts after closure can also generate economic opportunities.

Sources: Policy Horizons Canada; Statistics Canada; CanNor; United States Geological Survey
Description of Mineral Exploration Spending ($ millions)
Exploration spending in the territories varies significantly year to year in each territory, overall seeing moderate increases and decreases each year since a large decline after 2013.
| Geography | 2013 | 2014 | 2015 | 2016 | 2017 (Preliminary Estimates) | 2018 (Spending Intentions) |
|---|---|---|---|---|---|---|
| Yukon | 100.6 | 5.3 | 5.0 | 5.5 | 7.8 | 7.7 |
| Northwest Territories | 77.9 | 5.0 | 5.5 | 4.5 | 4.3 | 3.6 |
| Nunavut | 257.6 | 7.8 | 11.7 | 12.6 | 8.0 | 4.9 |
Other Economic Sectors
Canada's three territories are home to…
A diverse array of economic sectors, including tourism, cultural industries, agriculture and fisheries.
- Tourism opportunities that include aurora borealis viewing, adventure tourism and distinct Indigenous cultural experiences.
- 2,047 culture sector jobs and 0.3% of Canada's cultural GDP in 2016.
- 230 farm operators and 158 farms in 2016.
- Over $5 million in domestic exports of fisheries products in 2017.
Challenges and Opportunities
- Innovations in agriculture, such as hydroponic greenhouses, are opening doors for increased production and lowered costs of agriculture goods in the territories.
- Over the last 9 years, annual fisheries quotas (harvested value) in the territories have increased by $40 million and approximately 550 jobs have been created.
- Nunavut has seen an increase in cruise-ship visits over the past few years, but a lack of marine support infrastructure comparable to nearby Alaska, Greenland or Norway is a barrier for further development.

Sources: Statistics Canada; Canadian Heritage; CanNor; Parks Canada; Department of Fisheries and Oceans; Government of Nunavut Department of Economic Development & Transportation
Description of Tourism's Contribution in the Territories (2014)
Tourism is a contributor to both GDP and employment across the three territories.
| Yukon | Northwest Territories | Nunavut | Canada | |
|---|---|---|---|---|
| GDP | 2.7 | 1.7 | 1.2 | 1.9 |
| Employment | 7.5 | 4.7 | 1.9 | 3.6 |
Infrastructure
Canada's three territories are home to…
- 40% of Canada's landmass, but limited transportation infrastructure.
Did you know…
- The 137 km Inuvik–Tuktoyaktuk highway was completed in 2017 and is the first Canadian highway to connect with the Arctic Ocean.
- Both the northern part of the Northwest Territories and all of Nunavut rely primarily on marine transport and aviation.
Challenges and Opportunities
- Yukon has a well-developed road network with access points to British Columbia, Alaska, and an all-season highway which crosses the Arctic Circle.
- The effects of climate change are dramatic in the North, as fluctuating climatic conditions are causing the premature deterioration of transportation and other infrastructure.
- It is anticipated that satellite and space-based technologies will continue to play an important role in growing the northern economy in terms of facilitating more fluid and safer transportation systems.
- Sealifts are essential for many communities not connected to road networks, but ports lack basic infrastructure to enable safe and efficient sealift operations.
- Strategic infrastructure investments are needed to reduce the cost of living, adapt to climate change, and increase access to resources and other economic opportunities.
(% of communities*)

*Based on methodology developed by the Conference Board of Canada in the Study on Addressing the Infrastructure Needs of Northern Aboriginal Communities
Description of Indicators of Community Access to Transportation Networks (2014) (% of communities*)
Across the territories, transportation networks vary significantly, particularly between Nunavut and the other two territories. Data is presented by the percentage of communities per type of transportation network with access.
| Transportation Network | Yukon | Northwest Territories | Nunavut |
|---|---|---|---|
| Access to Marine Resupply Service | 13% | 44% | 100% |
| Access to an all seasons road network | 93% | 50% | 0% |
| Access to an airport | 93% | 91% | 100% |

Sources: The Canada Transport Act Review; Centre for the North at the Conference Board of Canada
Description of Primary Source of Community Energy (2014)
Diesel continues to be a significant source of community energy across the three territories. Data is presented by the percentage of communities per type of energy.
| Source of Energy | Yukon | Northwest Territories | Nunavut |
|---|---|---|---|
| Diesel Generator | 27% | 72% | 100% |
| Natural gas pipeline and diesel | 0% | 6% | 0% |
| Regional hydro grid and diesel | 73% | 22% | 0% |
Skills
Canada's three territories are home to…
- Three colleges: Yukon College, Aurora College, and Nunavut Arctic College.
- The highest employment rates in Canada in 2016 for persons with college certificates and above.
Did you know…
- Yukon College is on track to obtain university status in 2020.
- All three colleges currently have partnerships with southern universities to offer degrees programs, including Nursing, Law, Education and Indigenous Governance.
- 24% of territorial Canadians have a bachelor's degree or above, comparable to western Canada (23%).
Challenges and Opportunities
- The territories' Indigenous populations lag behind their non-Indigenous counterparts on educational attainment and adult skills.
- Some employers are starting career development programs in their industry to help their workers obtain the necessary skills to fill gaps.
Want to know more?

Description of Education Levels of Canada's Territories (2016)
Educational attainment across the territories varies, with close to 70% of the population aged 25-64 in Yukon having attained a postsecondary certificate, diploma or degree, compared with just over 60% in Northwest Territories and just under 45% in Nunavut having attained this level of certificate.
| Yukon | Northwest Territories | Nunavut | |
|---|---|---|---|
| No certificate, diploma or degree | 10.7% | 20.5% | 40.9% |
| Secondary (high) school diploma or equivalency certificate | 20.9% | 19.4% | 14.6% |
| Postsecondary certificate, diploma or degree | 68.4% | 60.1% | 44.4% |

Sources: Conference Board of Canada; Statistics Canada
Description of Major Field of Study in the Territories for the population aged 25 to 64 (2016)
Business, management and public administration, followed closely by architecture, engineering and related technologies, are primary fields of study for more than 14,000 people aged 25 to 64 across the territories in 2016.
| Field of Study | Territories (number of persons) |
|---|---|
| Personal, protective and transportation services | 3,190 |
| Health and related fields | 4,360 |
| Agriculture, natural resources and conservation | 1,485 |
| Architecture, engineering, and related technologies | 7,155 |
| Mathematics, computer and information sciences | 870 |
| Physical and life sciences and technologies | 1,375 |
| Business, management and public administration | 7,305 |
| Social and behavioural sciences and law | 4,150 |
| Humanities | 1,525 |
| Visual and performing arts, and communications technologiess | 985 |
| Education | 3,745 |
SMEs, Entrepreneurship & Innovation
Canada's three territories are home to…
- Just over 4,400 small and medium sized enterprises (SMEs) as of 2015.
- Two innovation hubs supporting local entrepreneurs.
- Three colleges and a number of Research Centers, including the Canadian High Arctic Research Station and the Yukon Research Centre's Cold Climate Innovation.
Did you know…
- New technologies, such as the SMARTICE tool, are being used in the North to monitor ice conditions for the information of locals, industries and scientists.
- The Northlight Innovation Hub brings together entrepreneurs, technology leaders, and forward-looking businesses to encourage innovation in Whitehorse, Yukon.
Challenges and Opportunities
- The territories have a large Indigenous population. Research shows that Indigenous entrepreneurs have a higher propensity to innovate, expand and profit than non-Indigenous led businesses.
- Recent connectivity investments of $85 million through the Government of Canada's Connect to Innovate program will generate new economic opportunities. For example, closing of the 'Canada North Fibre loop' through the new Dempster Fibre project will help position Inuvik as a world class location for satellite services.
- Access to venture capital can be extremely difficult for Northern entrepreneurs.
- Circumpolar Northern colleges, universities and research centers are comparatively small players in the national innovation economy; they are contributors in the development of the new economy in the North.

Description of Number of SMEs per 1,000 persons 15+ (2015)
Both Yukon and Northwest Territories have a higher number of SMEs per 1,000 people than the national level.
| Geography | Number |
|---|---|
| Canada | 39.2 |
| Yukon | 57.3 |
| Northwest Territories | 48.5 |
| Nunavut | 29.6 |

Sources: Statistics Canada; Canadian Council for Aboriginal Businesses; Innovation Science and Economic Development Canada
Description of Household Broadband Coverage at 50 Mbps (2018)
Broadband coverage across the territories varies significantly, falling below the national rural average in rural Yukon and Northwest Territories, and all across Nunavut.
| Geography | Urban | Rural |
|---|---|---|
| Yukon | 100% | 20% |
| Northwest Territories | 76% | 19% |
| Nunavut | 0% | 0% |
| National Rural Average | 41% |
Proposed Action Areas
Resource extraction sectors
Support the sustainable development of the resource extraction sectors in a manner which increases community capacity and maximizes jobs and wealth within the territories.
Economic diversification and innovation
Foster the sustainable growth of other economic sectors, such as tourism, with an initial focus on strengthened entrepreneurship and northern innovation.
Infrastructure investments and development
Leverage upcoming investments and the ongoing operation of major infrastructure projects to maximize local and regional economic opportunities.
Skilled workforce
Help build a northern workforce and equip Northerners with the tools, skills, and experience they need to succeed in the workforce, now and into the future.
Questions
- Are the four proposed action areas the right ones? If not, what would be your top four?
- For the economic diversification action area, what three sectors should be prioritized? How should Tourism be supported?
- For each action area, what specific activities should CanNor advance in collaboration with its partners?
- How can Indigenous economic development corporations and the private sector be engaged to increase the effectiveness of the four proposed action areas?
Ways to share your ideas
This engagement paper lays out the portrait of the territories' economic landscape to help you make your recommendations. Please send us your ideas by March 15, 2019.
Round tables
CanNor will be hosting a number of in-person and virtual roundtables across the territories to hear from you.
Written submissions can be sent by postal mail. As mail has a built-in delay, please mail your ideas and suggestions by March 15, 2019, to:
Canadian Northern Economic Development Agency
C/O: Pan-Territorial Growth Strategy Engagement
90 Sparks Street, 3rd Floor
Ottawa, Ontario K1P 5B4
Written submissions can be submitted by email to: cannor.cannorengage-mobilisationcannor.cannor@canada.ca
Online discussion forum
Sign up to submit your ideas through the online discussion forum.